Lab Automation — Turning Months of Manual Work Into Minutes
⚙️ Lab Automation — Turning Months of Manual Work Into Minutes
Between May and July 2025, I built something that completely changed the way I work in the lab.
I started with no formal coding experience — just curiosity and determination.
By the end of the summer, I had automated the data processing for most of our lab machines, cutting hours of repetitive work down to a few minutes.
Now, what once took me two hours — downloading raw data, formatting Excel tables, calculating results, plotting graphs — takes just 3–5 minutes.
And it all began in Thonny, the simplest Python IDE I could find.
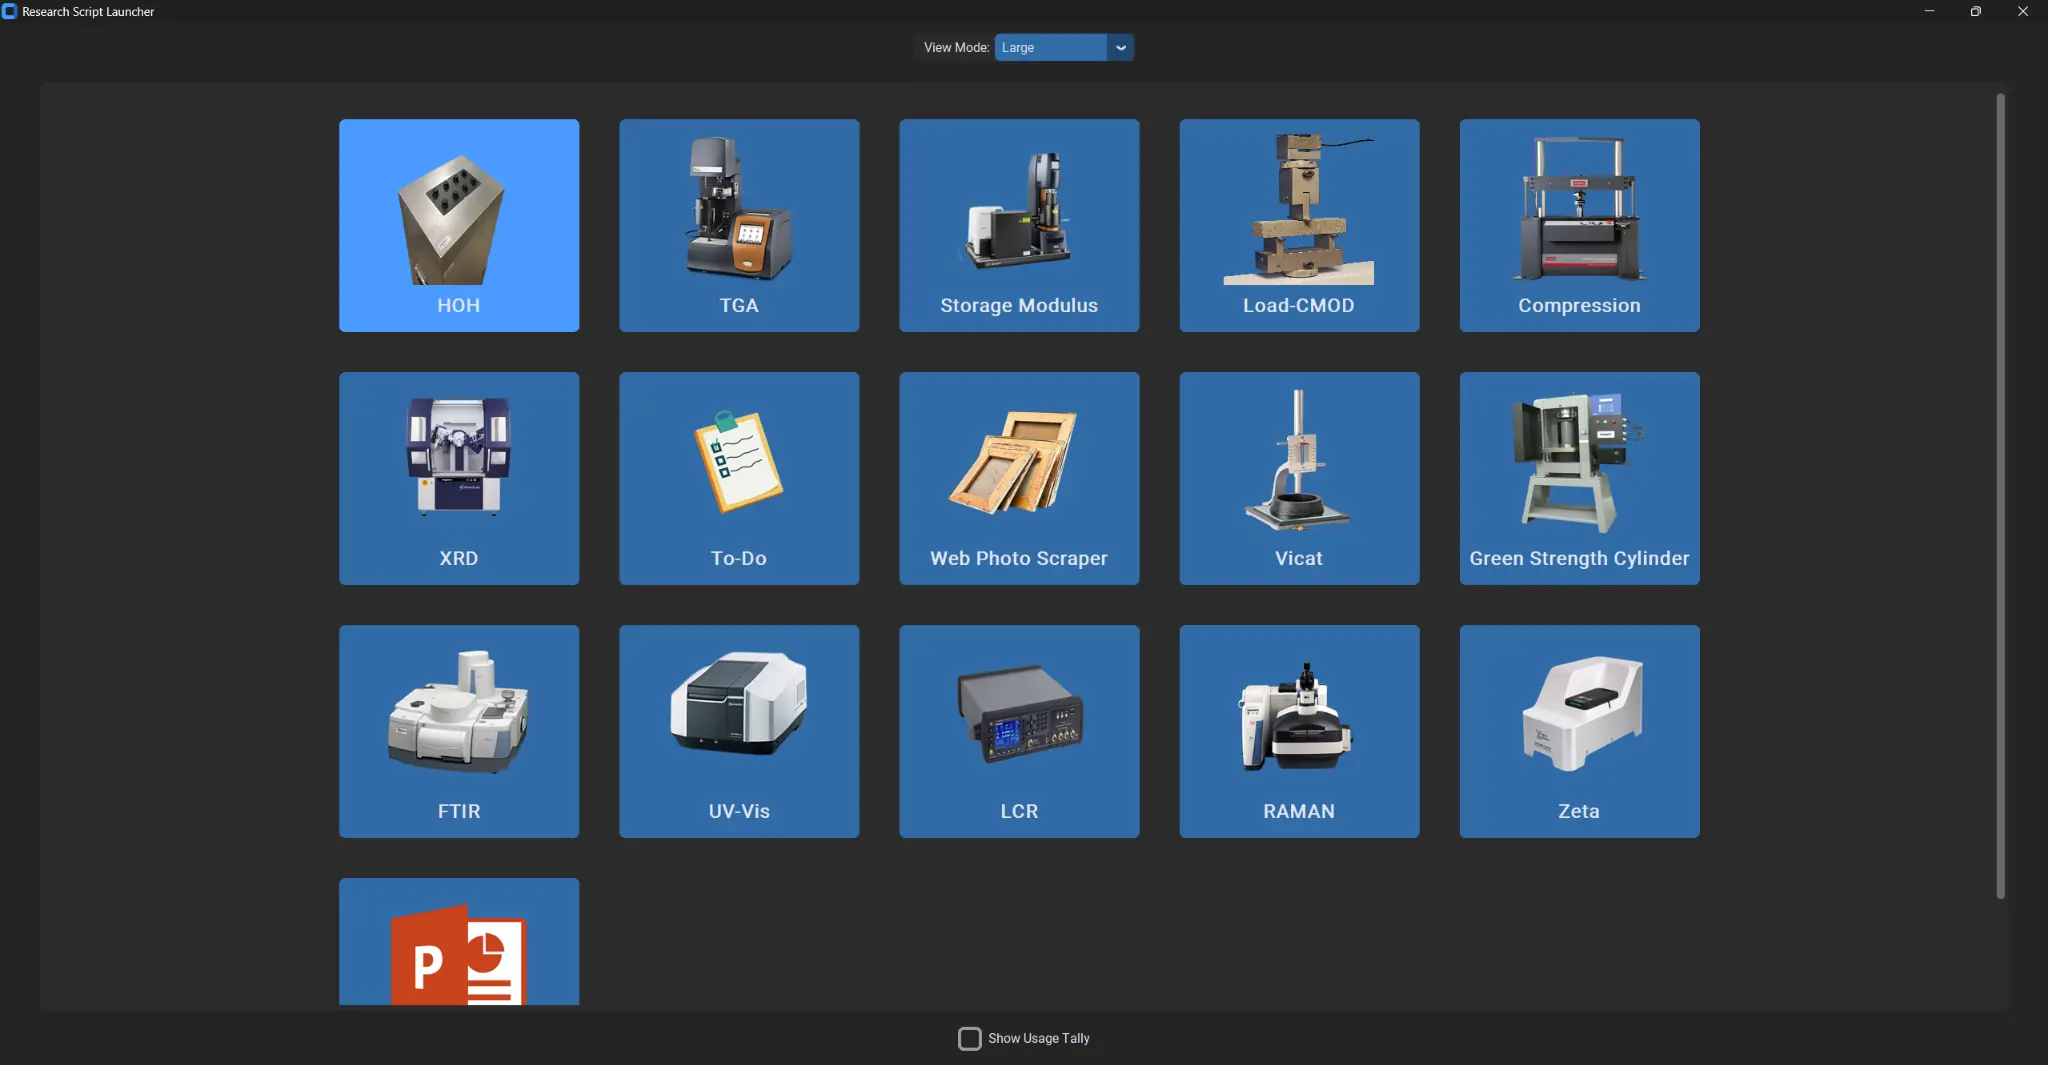
🧩 The Research Script Launcher

This app is called the Research Script Launcher.
Each tile represents a piece of lab equipment — and behind each one lies a full Python workflow I built from scratch.
- HOH — Heat of Hydration (Isothermal Calorimetry)
- TGA — Thermogravimetric Analysis
- Load-CMOD — Flexural Test Analysis
- Compression — Compressive Strength Curves
- XRD, FTIR, UV-Vis, Raman, Zeta, and others
Click a button → The corresponding Python script runs → You get a clean, formatted Excel file and pre-styled graphs ready for PowerPoint.
No more copying formulas. No more replotting data.
Just one click.
🔬 How It Works (Simplified)
Each Python script:
- Reads raw data files from the machine (CSV, TXT, or Excel).
- Processes the data — cleaning, calculating, and normalizing values.
- Generates formatted Excel workbooks with multiple sheets:
- Raw Data
- Calculated Parameters
- Mechanical Results
- Averages and Summaries
- Creates publication-ready graphs (colors, fonts, legends, etc.).
- Opens the Excel file automatically once done.
Everything follows the same structure — modular, consistent, and human-proof.
💡 The Learning Curve

When I began in May 2025, I didn’t know how to write a function or a for-loop.
I just knew what I wanted: automation.
Through trial, error, and a lot of late nights, I built code that:
- Communicated directly with instruments via PyVISA
- Generated Excel files with Pandas and XlsxWriter
- Designed GUIs with CustomTkinter
- Integrated plotting and formatting standards across projects
I wrote thousands of lines of code — and broke them thousands of times too.
But by July, everything clicked.
That feeling when the automation finally works?
Unmatched.
🧠 Example Script — Simplified
Below is a simplified conceptual example of how one script works (not the actual code):
def run_experiment(device):
    for freq in frequencies:
        r, x = device.measure(freq)
        data.append((freq, r, x))
    save_to_excel(data)
    plot_graphs(data)
Simple to look at, complex to perfect. Each instrument required its own communication protocol, timing logic, and output structure — all unified through one design philosophy: make it effortless. 🧮 Time Saved = Time for Research
Before automation:
2 hours per dataset
Multiple Excel sheets
Manual chart editing
Risk of human error
After automation:
3–5 minutes per dataset
Fully formatted workbook
Ready-to-insert graphs
0% manual error
That’s not just convenience — that’s time reinvested into discovery. 🧰 The App Ecosystem
This launcher connects everything:
HOH Analyzer → Reads calorimetry data and plots heat flow curves
TGA Processor → Normalizes weight loss and derivative curves
Load-CMOD Tool → Calculates flexural toughness, strength, and FCS
Vicat Timer → Automates setting time reports
Compression & Modulus Analyzer → Calculates strength/modulus, averages, and deviations
Photo Scraper → Captures experimental photos for archiving
To-Do Module → Personal research task tracker
Every machine, every dataset — unified under one interface. 🎓 Reflection
As a civil engineering PhD student, this was more than coding. It was system design — applied to scientific research.
Every hour spent debugging Python is now saving me dozens each month. And most importantly, it’s freeing me to focus on what really matters: understanding materials, not spreadsheets. 🚀 The Bigger Picture
This experience opened my eyes to how much manual academic work can be automated — especially in experimental research.
Data collection, cleaning, and graphing shouldn’t consume entire afternoons. Automation gives researchers their time back.
Eventually, I plan to expand this into:
Automated PowerPoint generation for reports
Integration with Google Sheets dashboards
Cross-lab usage tracking and data archiving
🔗 Related Posts
This article is part of the LifeLoggerz Automation Series:
1️⃣ Lab Automation — Turning Months of Manual Work Into Minutes (this post) 2️⃣ How My Load-CMOD Script Calculates Flexural Toughness
3️⃣ Automating Heat of Hydration and TGA Reports
4️⃣ Creating GUI Apps with CustomTkinter
5️⃣ Integrating Python with Google Sheets
“Automation doesn’t replace researchers — it amplifies them.” — LifeLoggerz
```