The Daily Snapshot: Summary of the Day using Raw Data in Google Sheets
📅 The Daily Snapshot: A Day of Data in Motion
The Daily Snapshot is where all the data from my Raw Data Sheets comes to life.
Every meal, outfit, quote, interaction, and diary entry funnels here, indexed from dozens of columns spread across my Google Sheets ecosystem.
This is the sheet that lets me see my life on a single page.
🧩 1. How It All Connects
Each day’s entry is more than just a record. It’s a product of 52 formulas drawing from the Current Year’s Raw Data Sheets.
Every dropdown I fill out adds to an expanding database: meals, people, weather, hobbies, even blunders and daily quotes.
Together, they form a living logbook of my year.
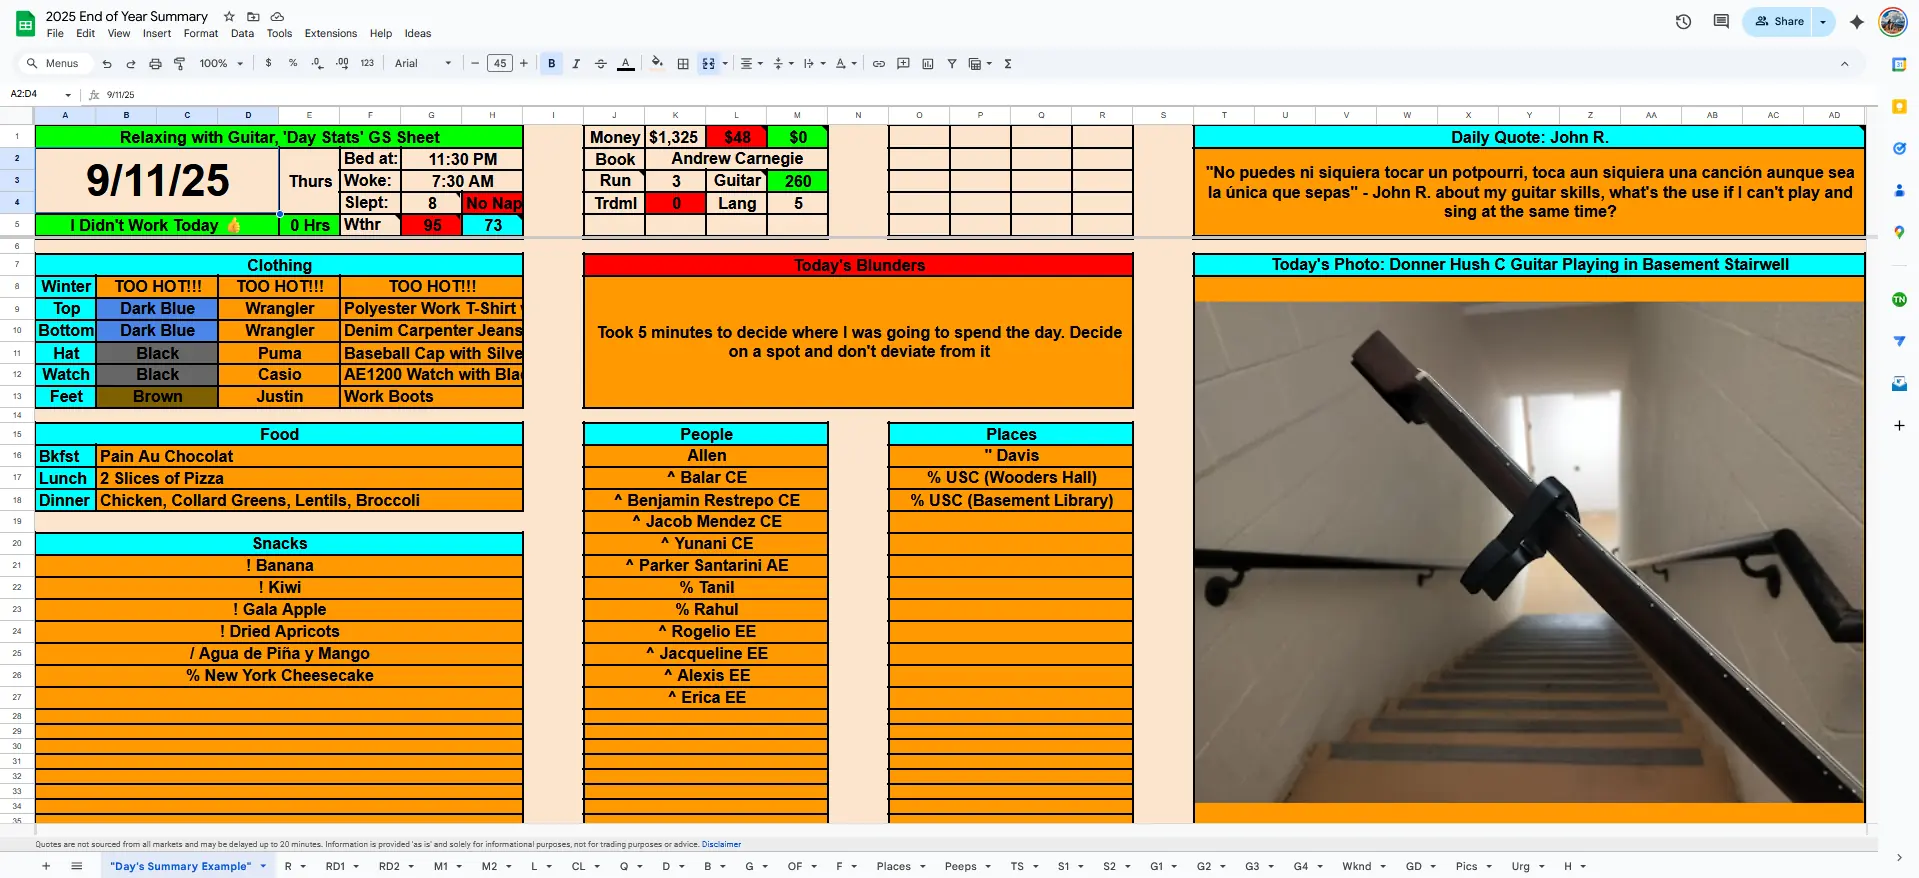
🖼 Daily Snapshot Overview
This is the “hub”, a dashboard of my day visually arranged with color-coded sections for:
- Sleep and Weather
- Money, Hobbies, Books
- Food, Snacks, and Clothing
- People and Places
- Daily Quote, Photo, and Blunders
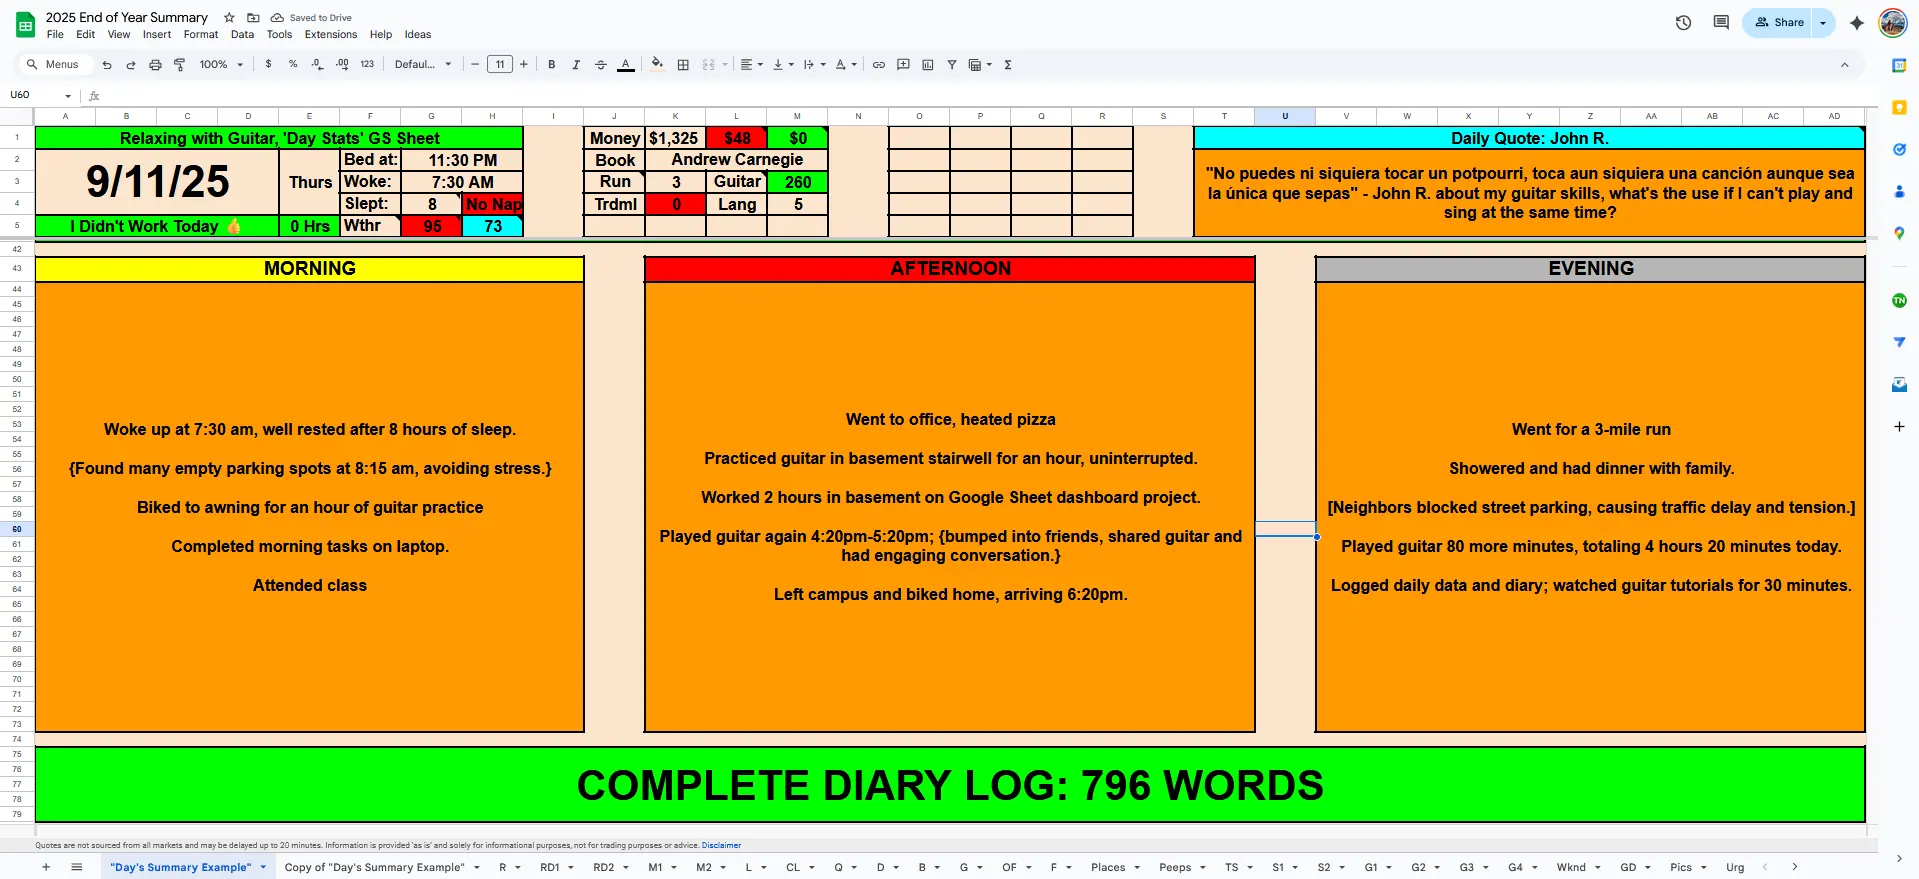
✍️ 2. Complete Diary Log

The Complete Diary Log section is written manually at the end of each day.
It captures context: what I did, thought, and felt that day, preserved with timestamps and formatting for reflection.
⚙️ 3. Condensed Diary Log (Automated with GAS + ChatGPT API)
To save time, I created an Apps Script function that uses the ChatGPT API to summarize my diary into a concise, human-readable format.
This becomes the “Condensed Log,” ideal for quick browsing or trend analysis later.
It’s automation serving awareness, not replacing reflection but amplifying it.
🔧 4. Behind the Scenes — INDEX, IFERROR, and Drive Integration

Underneath the visual layout lies a network of formulas, primarily INDEX(), IFERROR(), and MATCH(), all working in harmony.
Each section references its own sheet:
People, Places, Pics, RD1, RD2, and more.
Even the Photo of the Day is automated: Google Drive links are parsed with a REGEX formula and displayed using the IMAGE() function, creating a seamless Photo-A-Day experience directly in Sheets.
💡 Future post: “Automating Photo-a-Day in Google Sheets” — explaining how Drive, GAS, and regex combine to make this work.
🔮 5. Day-vs-Day Archive Comparison
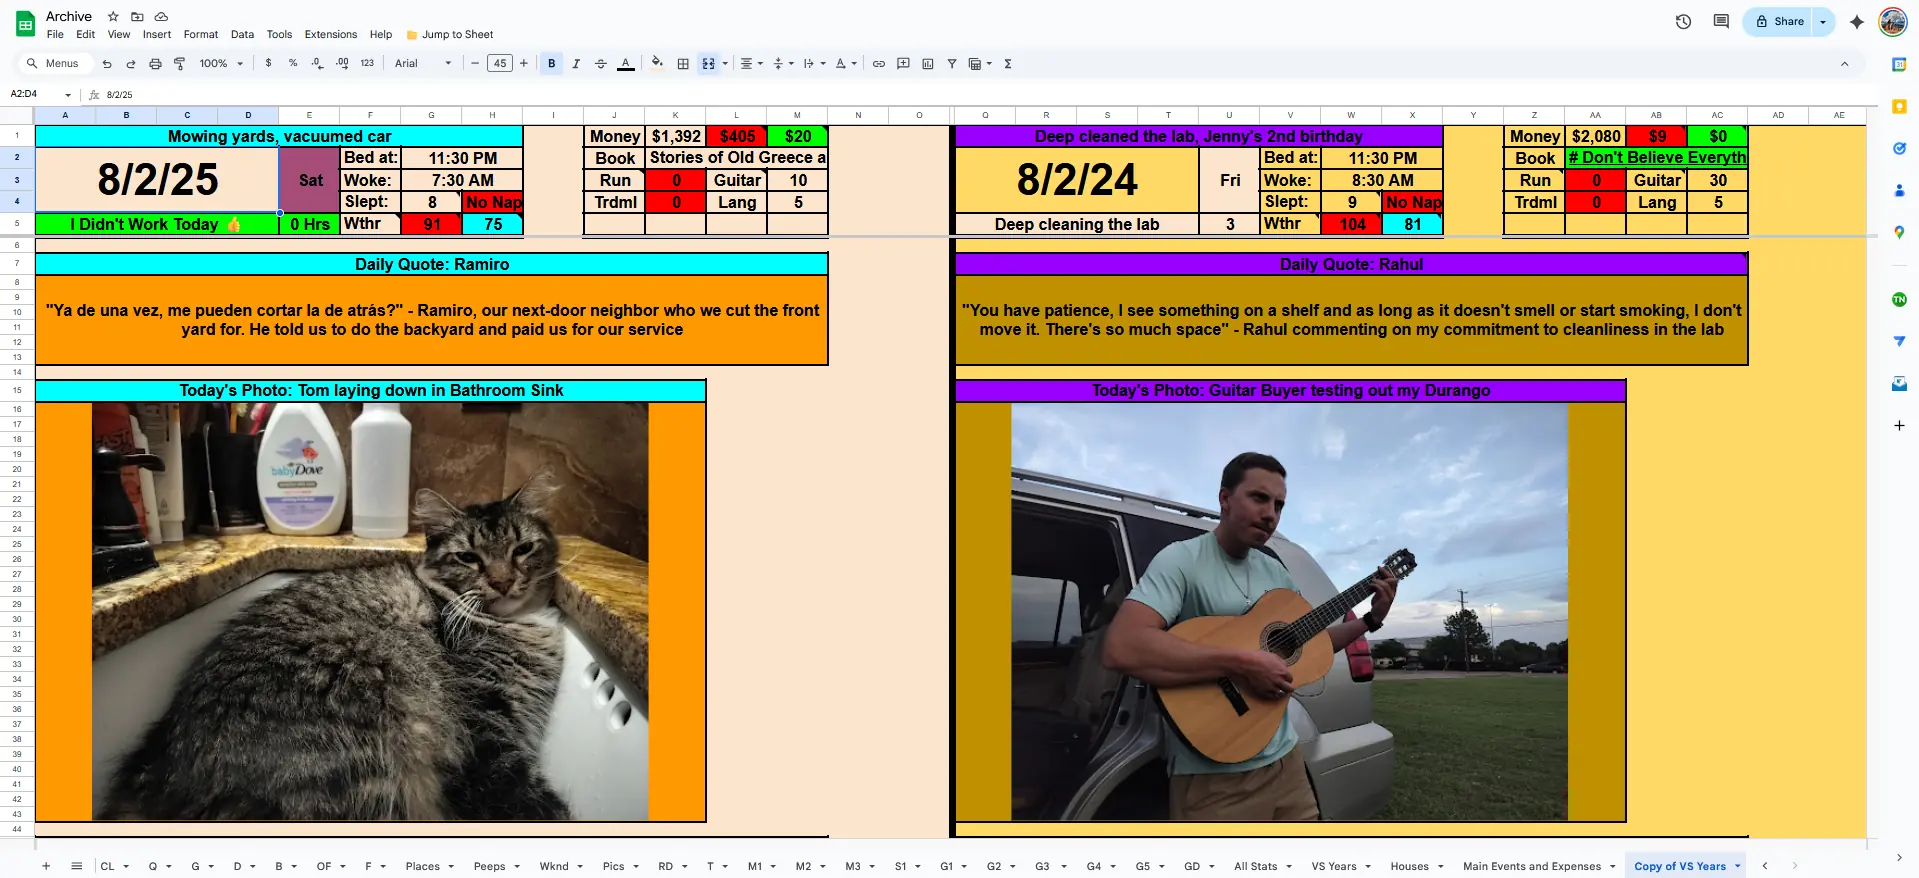
Once the Daily Snapshot becomes part of the Archive, it unlocks a new layer of reflection:
the ability to compare today to any other day in the past, even the same date a year ago.
This “crystal orb” effect lets me visualize change (where I was, what I wore, what I ate, and what I thought, etc), all drawn from the Archive’s indexed data.
“You can’t improve what you don’t measure.
But you also can’t appreciate what you don’t record.”
- LifeLoggerz